The Professional Employer Organization model has moved from a niche back-office solution to a mainstream workforce strategy. Whether you’re evaluating a PEO for the first time or benchmarking your current provider, the numbers below give a clear, sourced picture of where the industry stands in 2026 and where it’s headed.
What Is the Current PEO Market Size?
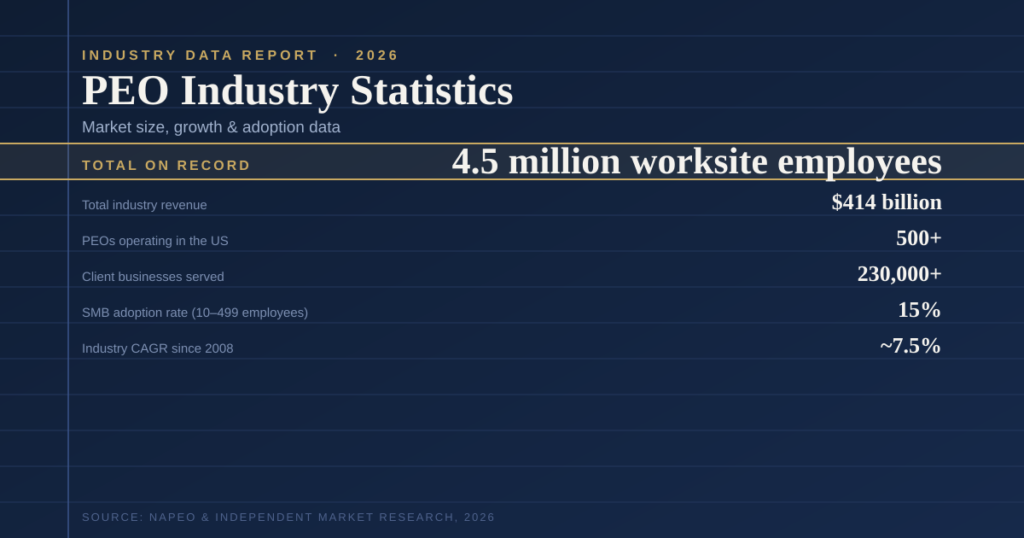
More than 500 PEOs currently operate in the United States, serving upward of 230,000 small and mid-sized businesses and covering roughly 4.5 million worksite employees, according to NAPEO’s most recent industry research. Combined revenue across NAPEO’s member PEOs alone reached an estimated $372 billion, with total industry-wide revenue closer to $414 billion.
That client base has grown substantially in a short window — up from roughly 175,000 businesses in 2021 — reflecting a steady shift toward outsourced HR infrastructure rather than a short-term spike.
PEO Market Size and Growth Trends
Independent market research firms frame the industry’s trajectory in slightly different terms depending on scope and methodology, but the direction is consistent: steady, above-average growth.
- The global PEO market is projected to grow from $81.75 billion in 2026 to $189.76 billion by 2034, a compound annual growth rate of 11.1%, according to Straits Research.
- The North America-specific PEO market was valued at $7.46 billion in 2026, expected to reach $10.43 billion by 2031 at a 6.93% CAGR, per Mordor Intelligence.
- On a longer historical view, NAPEO reports the industry has expanded at a compound annual growth rate of approximately 7.5% since 2008 — a pace that has held up across multiple economic cycles.
What’s driving this growth isn’t a single factor. Rising benefits costs, tightening labor compliance requirements, and the operational strain of managing HR internally are pushing more small and mid-sized employers toward co-employment as a structural choice rather than a stopgap.
How Many PEOs Operate in the US?
There are more than 500 PEOs operating in the United States, according to NAPEO. Within that group, NAPEO’s 187 member organizations account for over 90% of total industry revenue, meaning the bulk of PEO activity flows through a relatively small number of established firms.
Market concentration follows a similar pattern on the employee side: the five largest PEOs handle an estimated 39% of all worksite employees industry-wide, the next 25 largest firms account for another 19%, and the remaining several hundred PEOs collectively represent the balance, according to NAPEO’s PEO Industry Footprint analysis. This distribution is worth understanding if you’re comparing providers — size alone doesn’t determine fit.
PEO Adoption Rate by Small Business
Roughly 15% of all US employers with 10 to 499 employees currently use a PEO, based on NAPEO’s 2025 research. That penetration rate isn’t evenly distributed across company sizes: businesses with 50 to 99 employees show slightly higher adoption at around 15%, while the 20-to-499-employee segment sits closer to 14%.
This concentration makes sense operationally. Companies in this range are often large enough to face real HR compliance exposure — multi-state payroll, benefits administration, workers’ compensation — but not yet large enough to justify a full internal HR department.
How Many Employees Are Covered Under PEO Co-Employment?
PEO co-employment arrangements currently cover approximately 4.5 million worksite employees in the United States. To put that figure in perspective, NAPEO notes it’s roughly equivalent to the combined workforce of the four largest employers in the country.
The growth pattern behind that number is steady rather than sudden: over the past three decades, the industry has added an average of about 100,000 worksite employees and 6,000 net new client companies every year.
Which Industries Use PEOs the Most?
Adoption skews toward a handful of verticals where compliance complexity or workforce variability makes outsourced HR particularly valuable:
- Professional, scientific, and technical services — historically the largest single client category
- Manufacturing — a consistent second-largest segment
- Construction — high adoption driven by multi-state licensing and workers’ comp complexity
- IT and telecom — the fastest-growing vertical in recent market data, capturing roughly a quarter of the North America PEO market by industry share
- Healthcare and life sciences — projected to be the fastest-growing vertical through 2031, per Mordor Intelligence
Geographic concentration follows client industry patterns, with Florida, Texas, California, and New York historically representing the largest share of PEO clients nationally.
Cost Savings Businesses See From Using a PEO
Based on data from more than 15,900 businesses studied in NAPEO’s 2024 White Paper, companies using a PEO reported an average 16% increase in profitability compared to similarly sized businesses managing HR internally.
On direct cost efficiency, the same research found businesses investing an average of $1,395 per employee annually in PEO services realized approximately $1,775 in savings per employee — a reported return on investment of 27%. Separately, PEO clients showed an annual turnover rate of 50.4%, compared to 57.6% among non-PEO businesses, a gap that held even after controlling for faster headcount growth among PEO users.
Professional Employer Organization Trends to Watch
A few shifts are worth tracking heading into the next few years:
PEO and EOR models are converging for global employers. The international PEO and EOR services market is projected to grow from $11.04 billion in 2026 to $22.3 billion by 2035, an 8.1% CAGR, as more companies need compliant hiring across borders without setting up local entities.
Technology-driven service delivery is becoming table stakes. Cloud-based platforms and self-service HR portals are shifting from differentiators to baseline expectations among PEO clients.
Vertical specialization is increasing. Rather than one-size-fits-all service bundles, more PEOs are building compliance and benefits expertise around specific industries like healthcare, construction, and technology.
Mid-market adoption is rising. While small businesses remain the core client base, larger employers in the 100-to-499-employee range are increasingly using PEOs for specific functions like benefits administration or multi-state compliance, rather than full HR outsourcing.
Frequently Asked Questions
How big is the PEO industry in 2026? The US PEO industry serves more than 230,000 client businesses and covers approximately 4.5 million worksite employees, with total industry revenue estimated near $414 billion.
What percentage of small businesses use a PEO? Approximately 15% of US employers with 10 to 499 employees currently use a PEO, according to NAPEO’s most recent research.
How many PEOs are operating in the US right now? More than 500 PEOs currently operate in the United States, though a small number of large firms handle the majority of worksite employees and revenue.
What is the average cost savings businesses get from using a PEO? NAPEO’s 2024 White Paper found an average ROI of 27% in cost savings, with businesses saving approximately $1,775 per employee against an average investment of $1,395 per employee.
Is the PEO industry growing or shrinking? The industry is growing steadily, with NAPEO reporting a compound annual growth rate of approximately 7.5% since 2008 and independent market research projecting continued double-digit growth globally through the early 2030s.
The Bigger Picture
The data points in one direction: co-employment has moved well past early adoption and into a stable, growing segment of how mid-sized businesses handle HR, benefits, and compliance. The next few years will likely bring more overlap between PEO and EOR models, deeper industry specialization, and continued penetration into the mid-market — trends worth watching whether you’re currently using a PEO or still evaluating whether the model fits your business.
Sources:
- NAPEO — Industry Overview
- NAPEO — PEO Industry Footprint White Paper
- Employ Borderless — How Many Companies Use a PEO?
- Straits Research — PEO Market Size Report
- Mordor Intelligence — North America PEO Market Report
- Business Research Insights — International PEO and EOR Service Market
- PEO Consultants — PEO Industry Statistics: What the Data Actually Shows